2
CSSplay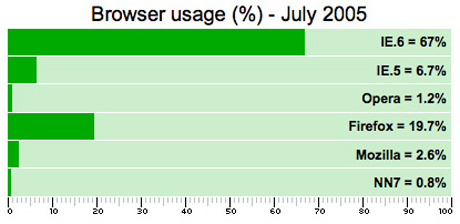
Bar charts provided in these visualizations are a definitive list with styles and classes defined in each line. The first chart has an error which occurs when the values get closer to 100% which is corrected in the second chart.
Stay Curious My Friends