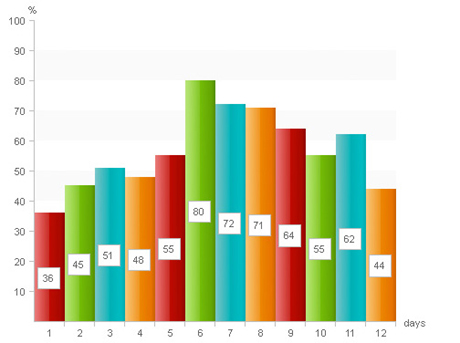
6 DatachartAlen Grakalic teaches you to build a data chart using CSS and markup using a structural and semantically definition list where definition titles can be on the x-axis and description on y axis.Pages: 1 2 3 4 5 6 7 8 9 10 11 12 13 14 15 16 17 18 19 20 21 22 23 24 25 26 27 28 29